Trainer Form Decoded: How to Spot Consistent Performers and Hidden Gems in Australian Racing
Published on February 14, 2026
Why Trainer Performance Matters: Case Studies of Big Upsets
Trainer form analysis Australian horse racing often explains the surprise victors that leave punters baffled. In the 2023 Spring Carnival, a modest trainer with a 42% win rate over sprint distances guided an unfancied horse to a Group1 upset at Randwick. Likewise, a veteran who excels on wet tracks delivered a surprise win at Flemington when the track turned sloppy. These stories show that understanding a trainer’s habits can turn a longshot into a value bet.
“A trainer’s consistency is the quiet engine behind every winning run.”
Key Metrics to Evaluate
When you start dissecting trainer form, focus on the data that matters most. The following metrics give a clear picture of a trainer’s strengths:
- Win% by distance – Does the trainer prefer sprints, middle distances, or staying races?
- Track‑specific win% – Some trainers have a home‑track advantage.
- Class level performance – Success at Group1 versus Listed races can indicate how well they handle elite fields.
- Post‑position trends – Certain trainers position their horses better from inside draws.
These figures often surface in the “trainer statistics” sections of race cards and official sites. Use them alongside “trainer win rate trends” to spot patterns that others miss.
Building a Simple Trainer‑Form Tracker Using Public Data
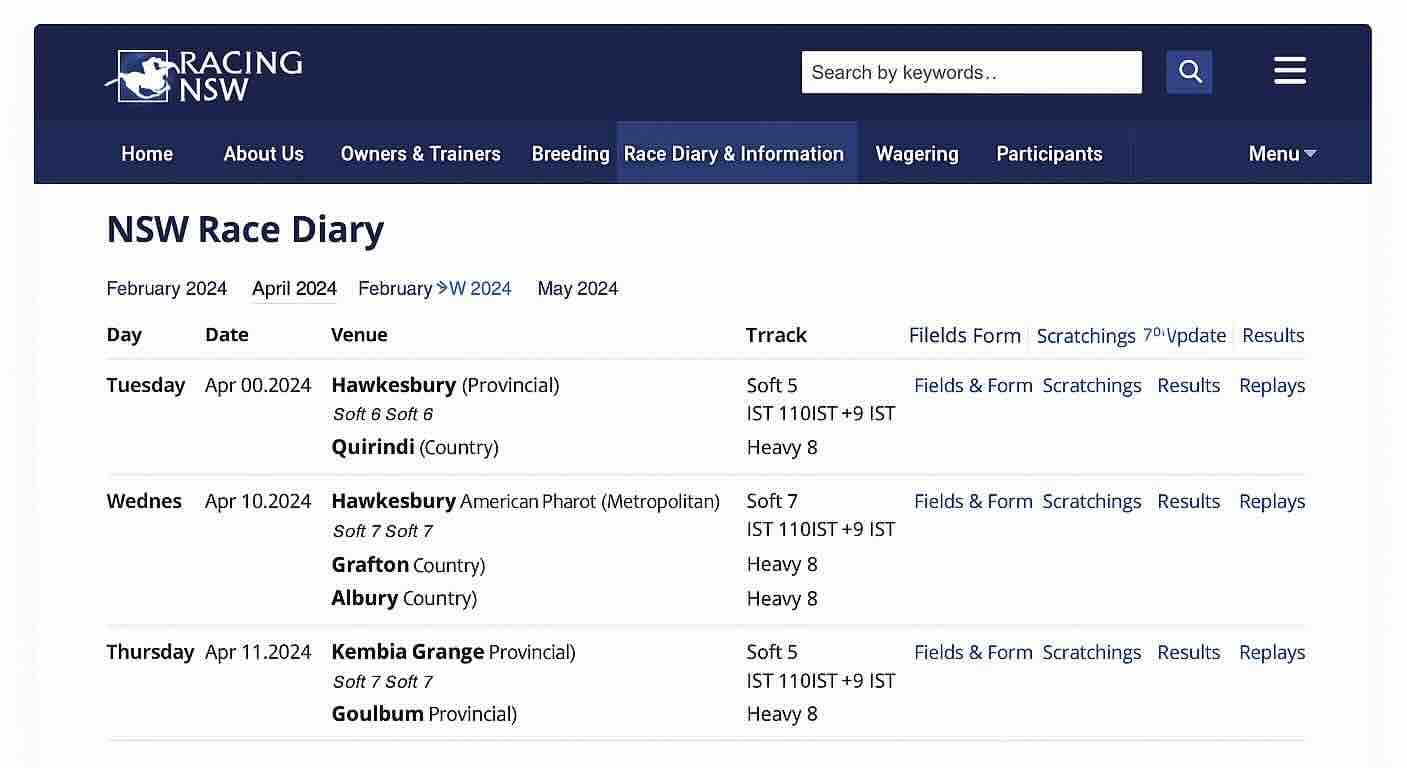
Collecting the right numbers is easier than you think. Start with the official Racing NSW Diary to pull daily trainer results, then log them in a spreadsheet.
- Create columns for Date, Trainer, Track, Distance, Class, Finish Position, and Post‑Position.
- Add formulas to calculate win% for each dimension over the last 6‑8 weeks.
- Refresh the sheet weekly to keep the data current.
You can also reference the guide Decoding the Race Card: A Beginner’s Guide to Reading Australian Race Forms to locate trainer info on each race card.
Integrating Trainer Insights with Horse, Jockey and Pace Analysis
Trainer form doesn’t stand alone. Blend it with other factors for a fuller picture:
| Factor | How Trainer Data Helps |
|---|---|
| Horse form | Match a horse’s recent runs with a trainer who excels at that distance. |
| Jockey partnership | Some trainers consistently pair with top jockeys; note those combos. |
| Pace scenario | Trainers who favor early speed can influence the race’s tempo. |
By overlaying these layers, you move from gut feeling to a data‑driven story about how a race will unfold.
“Data beats instinct when you can measure the trainer’s impact.”
Practical Betting Strategies: Trainer‑Based Value Bets and Dutching
Once your tracker highlights a trainer who’s hot on a given track, you can shape your wagers:
- Value bet – Back a horse trained by a high‑win‑% trainer even if the odds look modest.
- Dutching – Spread stakes across two or three horses from the same trainer when their combined win% suggests a higher chance than the market reflects.
These approaches let you capture the “trainer impact on betting” without over‑committing to a single runner.
For those looking to embed trainer metrics into a broader predictive model, see the next step in Building Your Own Horse Racing Betting Model with Historical Data.
Tools and Resources for Ongoing Trainer Monitoring
- Racing NSW Diary – Daily updates on trainer results; perfect for the mid‑section of your tracker.
- Breednet & Racing.com – Provide downloadable CSVs for deeper historical analysis.
- Google Sheets or Excel – Simple yet powerful for calculations and visualisations.
Regularly revisit the “trainer statistics” page on each race card and update your spreadsheet. Over time, patterns emerge that can give you a steady edge in the betting market.
Happy tracking, and may your next tip be a hidden gem uncovered through solid trainer form analysis!