Speed Ratings & Sectional Times Explained in Horse Racing
Understanding speed ratings in horse racing and sectional times gives sharper insight into a horse’s actual performance beyond raw finishing times. By analyzing speed ratings horse racing, horse racing speed figures, and sectional times horse racing, you can make well‑informed wagering decisions. This guide explains the concepts, shows chart reading, and gives practical tips for handicapping.
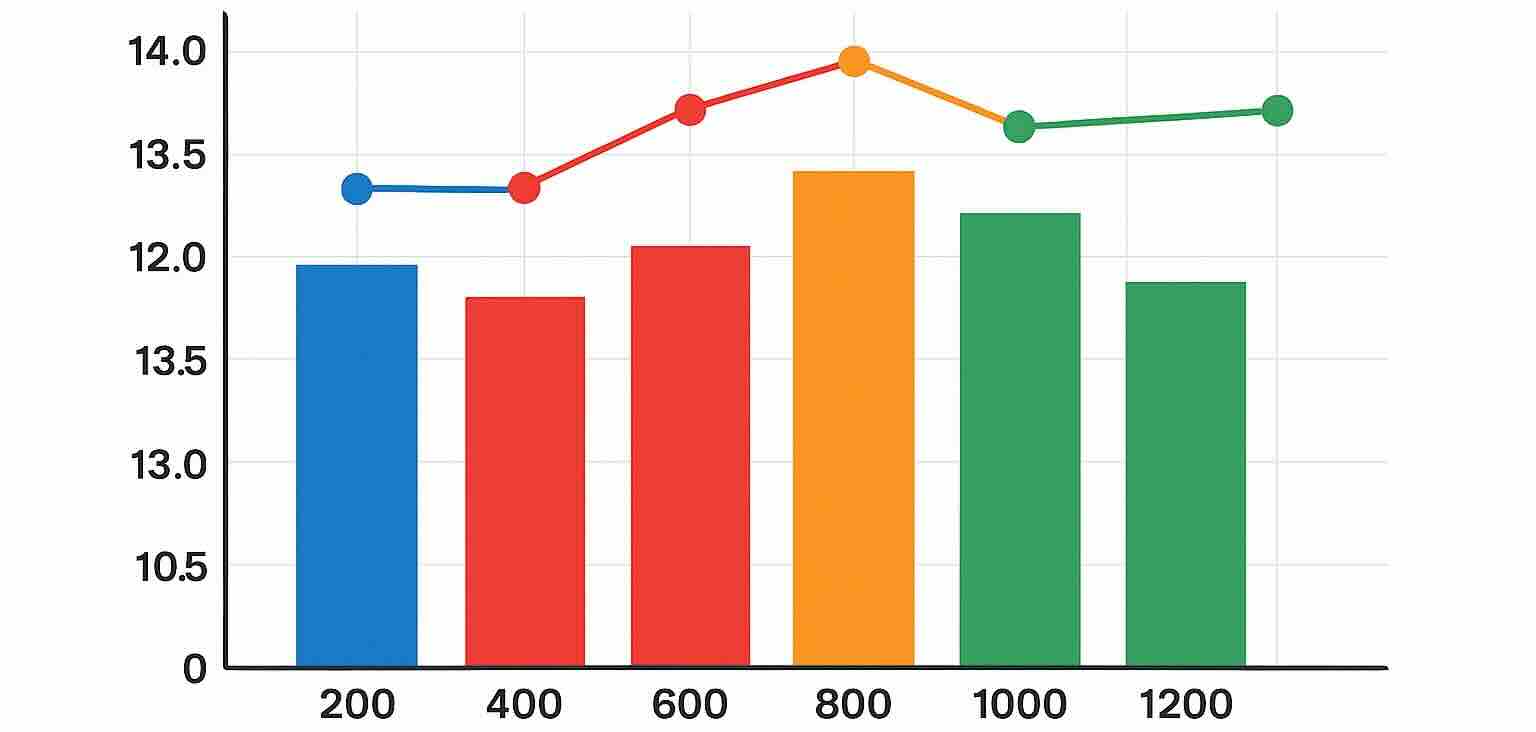
1. Raw Time vs Sectional Splits
- Raw Time: The total time it takes for a horse to complete the race (e.g., 1:36.40).
- Sectional Splits: Intermediate times recorded at specific points (e.g., 400m, 800m, 1200m, final).
- Why it matters: Raw time tells you how fast overall, but sectionals reveal pace — where the race was fast or slow, and which horse accelerated late.
| Distance | Time | Comment |
|---|---|---|
| 400m | 24.8 s | Rapid early pace |
| 800m | 49.0 s | Slowing down |
| 1200m | 74.5 s | Set up for a sprint finish |
| 1600m | 1:36.4 | Overall time – tells less |
Sectionals add context to raw times and can highlight athletes that finish strongly — a key for making predictions.
2. Sources for Speed Data
Top reputable places to get speed data include:
- Timeform: Offers comprehensive speed ratings and sectional data globally. Known for the Timeform Rating.
- Racing NSW: Provides sectional times and speed figures for races in New South Wales.
- Racing Post (UK/Irl): Publishes Speed Figures prominently.
- DRF (Daily Racing Form, US): Focused on BRIS Speed Ratings.
- Equibase (US): Supplies raw race times and day-of data.
Each provider may use different scales, so compare like-for-like when analyzing ratings.
3. Reading a Sectional Chart (Step-by-Step)
- Columns:
- PP: Post position
- Horse Name: Name of the horse
- 400m / 800m / 1200m / Finish: Sectional times
- Position by Section: How far a horse was behind leaders
- Interpreting it:
- A fast final 400m (e.g., 23.5s) suggests a strong closer.
- A consistent pace over all sections might indicate stamina.
- Using it:
- Compare sectional patterns between horses.
- Identify if a race favored front‑runners or late-runners based on splits.
4. Speed Figure Bands & Their Meaning
| Speed Figure | Class Level | Meaning |
|---|---|---|
| 50–70 | Maiden / Claiming | Emerging horses, new to racing |
| 70–90 | Low/Med Claimer | Mid-level competitors |
| 90–105 | Allowance / Mid-grade | Decent class, often competitive |
| 105–120 | Stakes / Listed | High quality, stakes-level runners |
| 120–140 | Group / Grade 1 | Elite horses, top international races |
| 140+ | Exceptional | Rare, extremely fast & consistent |
Bands help assess if a horse is stepping up or down in class.
5. Applying Ratings to Handicapping
- Compare last races: Focus on recent speed figures to measure current form.
- Contextualize sectionals:
- A horse with a fast finishing split might enjoy softer pace in an upcoming race.
- A challenger with slow final splits may struggle in a fast-run race.
- Consistency matters: Look for horses posting consistently strong figures.
- Class shifts:
- A horse dropping in class but maintaining strong figures may have an edge.
- Track impact:
- Adjust figures for rain or heavy tracks.
- Evaluate differences in ratings on turf vs dirt. See more in Track Conditions: Key Insights and Track Conditions Guide.
- Look for outliers:
- A horse with an unusually high figure compared to its history may indicate potential — but check if it was a fluke.
6. Sectional Times Jargon Glossary
- Split: A segment of a race (e.g., 400m split).
- Tempo: Overall pace of a race, measured by first half or splits.
- Late Splits: Times in the final segment — good for spotting closers.
- Cumulative Time: Combined time from start to a split point.
- Par Time: Average or benchmark time of a given course/distance.
- Rated Run: Period when jockey restrains horse for a future move.
See also our Horse Racing Glossary.
7. Practical Example in Handicapping
Imagine Race 6 at a 1600m distance:
- Horse A: Speed figure 115, final 400m split 23.8s.
- Horse B: Speed figure 105, final split 25.2s.
- Horse C: Speed figure 112, balanced sectionals with 24.5–24.8s.
Interpretation:
- Horse A shows elite finishing speed and class.
- Horse C shows consistent stamina and form.
- Horse B’s figure is lower and had slower finale — may struggle unless pace suits.
8. Tips & Common Mistakes
- Don’t focus only on raw times: Always check how the time was achieved.
- Beware anomalies: Slow tracks or weather can distort numbers.
- Track variants matter: A 110 rating on turf may not equal a 110 on dirt.
- Trends over one race: Use recent 3–5 races for a better trend picture.
Read useful tips in our post Unlock Winning Strategies.
Understanding speed ratings horse racing and sectional times horse racing transforms handicap analysis. With sources like Timeform and Racing NSW, you can access accurate data — then apply figure bands, chart reading, and smart interpretation to uncover betting value. By mastering this, you’re better positioned to identify strong performers, pace maestros, and potential dark horses.
Frequently Asked Questions (FAQs)
Q1: What is the difference between raw time and sectional times?
A: Raw time is total race duration; sectional times are intermediate splits that reveal pace and stamina dynamics.
Q2: Which system offers the best speed figures?
A: It depends — Timeform and Racing NSW are strong internationally, while BRIS and Racing Post are trusted in North America and Europe.
Q3: How do I compare figures across systems?
A: Use relative bands (e.g., 70–90 = claiming level) rather than raw numbers, since scales differ.
Q4: Why are sectional times important?
A: They indicate pace trends and reveal if a horse finished stronger or weaker than raw time suggests.
Q5: How many recent races should I analyze?
A: Review the last 3–5 performances to spot form consistency and trends.
Q6: Can weather affect figures?
A: Absolutely. Soft or heavy tracks slow times; figure normalization may be needed.