Sectional Times in Barrier Trials: How to Decode Workout Data for Race-Day Readiness
Published on September 26, 2026
You’ve seen the trial times on the form guide: 1000m in 1:01.2. Solid. Fast. Maybe. But that final time alone tells only half the story, and sometimes less. The real signal lives in the split times, especially how those sectionals stack up against the pace, the track, and the horse’s previous performances. That’s where sectional times in barrier trials become your best early-warning system for race-day readiness.
For intermediate punters, those who’ve moved past win/place odds and into the mechanics of performance, cross-referencing trial sectionals with race-day conditions is the next logical, overlooked step.
Why trial sectionals matter more than final times
A horse can post a quick 1000m trial time, but if it’s all front-end speed with no finishing kick, it won’t translate to a 1200m handicap where patience is key. In contrast, a horse that runs a 1000m trial in 1:03.5 but clearly runs its last 200m faster than any other part of the trial may be building stamina, and it could be better than the market expects when it steps up in distance.
Here’s what trial sectionals reveal that final times don’t:
- How it quickens — how quickly the horse lifts from a relaxed pace
- Sustainability — whether the last 200m is faster or slower than the first
- Adaptability — how the horse handles varying tempos (e.g. leading versus settling just behind the speed)
If you want a refresher on what to watch in the trial itself, from the jump to the way a horse finishes and recovers, start with Using Barrier Trials in Form Study. It pairs well with the numbers we look at here.
“A trial winner with flat sectionals is often a one-race wonder. The ones that improve through the run tell you something different: they’re still developing.”
How to extract and compare sectionals across trials
Not every trial comes with the same data. Some meetings publish splits for each section, others give only the last 600m or just a final time. With a little care, though, you can still compare one trial with another fairly.
Start by standardising the distance. Break each trial into 200m sections where the data allows. If you only have the final time and one split, you can work out the missing part by subtraction. For example, if you know the full time and the last 400m, the rest of the trial is simply the difference.
Next, think about the track. One venue might be flat, another might have a rise in the straight. Rather than trusting a raw number, compare it with other trials at the same venue in recent months, so you know what a “normal” run looks like there.
Finally, compare like with like on gear. Blinkers, visors or a first run without them can change how a horse settles and how hard it pulls, so note every gear change next to the sectionals.
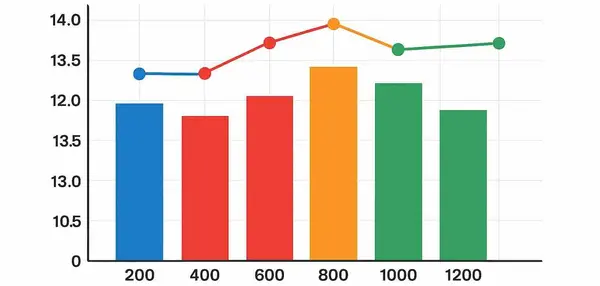
Here’s a simple illustration of three horses over the same 1000m trial. The figures are made up to show the method, and each set of five 200m splits adds up to the final time.
| Horse (illustration) | 200m splits (seconds) | Final time |
|---|---|---|
| Horse A | 12.8, 12.2, 12.0, 11.6, 11.4 | 1:00.0 |
| Horse B | 12.0, 11.8, 11.9, 12.2, 12.5 | 1:00.4 |
| Horse C | 13.2, 12.6, 12.2, 11.7, 11.5 | 1:01.2 |
Notice the pattern? Horse B posted a quicker final time than Horse C, but it went hard early and slowed through every section after the second. Horses A and C did the opposite: they started steadily and got quicker all the way to the line. Horse C has the slowest time of the three, yet its finish is the kind of fitness signal you want to watch for.
“A trial tells you what the horse was asked to do. The sectionals tell you how much it had left.”
Key patterns worth looking for
These are rough rules of thumb, not proven formulas, so treat them as a starting point and test them against your own notes over time. These are the three patterns worth looking for first when you link trial sectionals to race performance:
- Late-speed consistency — as a starting point, look for a horse whose last two 200m sections are close together or getting quicker (like Horse A’s 11.6 then 11.4). It suggests the horse can hold its speed under pressure, which is what a race will ask of it.
- Quickening from a relaxed start — a steady first half followed by clearly quicker sections in the second half suggests the horse settles and still has speed to use. Look for this in horses stepping up in distance.
- Stamina sign: no fade after halfway — the horse keeps getting quicker or holds its speed through the middle and the last 400m, rather than slowing after the first half. Horses A and C do this in the table; Horse B doesn’t.
If you want the basics of reading race splits and finishing speed, Sectional Times: Finding Value Runners explains where the data comes from and how to spot runners whose finish is better than their placing suggests.
Adapting trial sectionals to race-day conditions
You’ve got the sectionals. The next step is translating them to the race you’re assessing.
Distance steps
If a horse ran 900m in trials and is now at 1200m, look for a relaxed first half and a last 400m that is quicker than the sections before it. That tells you the horse can switch off early and still finish, which is exactly what the extra distance will ask of it.
Track and surface
Some tracks suit horses that go forward, others reward horses that finish. A rain-affected surface changes both. The quickest way to get a feel for the day is to check the other trials run at the same meeting: if every horse that finished well came from the back, the times will reflect that.
The surface also changes the raw numbers. Splits on a firm track usually look sharper than splits on a soft or heavy one, so don’t expect a horse to repeat its trial figures on a different surface. Judge the shape of the curve, not the raw times.
A heavy-track trial will look slow on the clock, so don’t mark a horse down for the time. Judge the shape of its finish, and treat its first run on a good track as a question mark until it has shown it can handle one.
Cross-referencing with race-day factors
Sectional data never lives in isolation. Once you know a horse’s trial shape, layer it with what you know about the race.
Start with the jockey. If the new rider tends to ride quietly and give horses time to find their stride, a horse with a slow first 200m in trials may now get the patience it needs to show its true acceleration. Watch a few of that rider’s recent races rather than relying on reputation.
Then look at the barrier. A horse that finishes strongly in trials can often cope with a wide draw at a big track with a long straight, where it has time to wind up. On a tight track with a short straight, a wide draw is a bigger worry, and a strong finish may not be enough.
Track bias is the last layer. On straight courses and tracks with long straights, strong finishing sectionals carry more weight, because the race is usually decided late. On tracks where leaders tend to hold on, early speed in the trial matters more.
Check Decoding Barrier Trials: A Punter’s Guide to Reading Australian Pre-Race Workouts and Form for more on reading gear, track context, and form cross-checks.
A 4-step framework to turn trial sectionals into selection criteria
Let’s pull it together. Here’s how to use trial sectionals in your weekly prep:
- Filter for relevance — keep only trials run in the last 28 days, where the horse was genuinely asked to work (check gear, jockey, margin), and ideally at a distance close to the race distance. If the gap is bigger, lean more on the shape of the last 400m than on the final time.
- Check the acceleration curve — look for a final 200m that is clearly faster than the first. If not, mark it down unless other factors (e.g. big fitness jump, trainer trend) intervene.
- Adjust for race distance and conditions — ask whether the trial pattern suits the race. A horse that quickened late over 1000m is a better fit for a step up in distance than one that faded, and a different surface means you compare shapes, not raw numbers.
- Validate with race-day inputs — combine with barrier draw, jockey, and track bias. If the trial sectional pattern is strong and the race-day setup aligns, that’s a selection worth backing at the right price.
Start with one horse per race. Track it. Over time, you’ll build your own “trial-to-race” conversion benchmarks.
If you walk away with one thing: don’t chase trial win times. Chase acceleration curves that match race demands.
Next time a trial meeting comes up, pick a few runners, compare their splits, and test the framework. You may find that how a horse finished tells you more than how fast it went.